Paleoclimate Tools
Computational tools for paleoclimate research and data.
 |
|
|
| A tool that helps users build and send SQL queries to the ICE-D database and dynamically returns the query results. |
|
 |
|
|
| Explore the volume of ice on Earth, its rate of change, and insolation at 65°N over the last 4 ice ages. |
|
HPC-based tools
These tools use high-performance computing (HPC) resources at University at Buffalo CCR to access datasets and to perform parallel computations. All interaction with the computing cluster is handled by the tool, while users interact with a friendly user interface.
 |
|
|
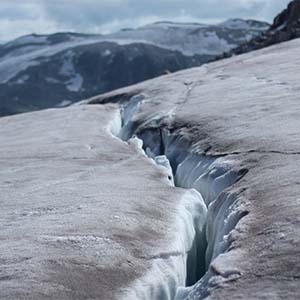
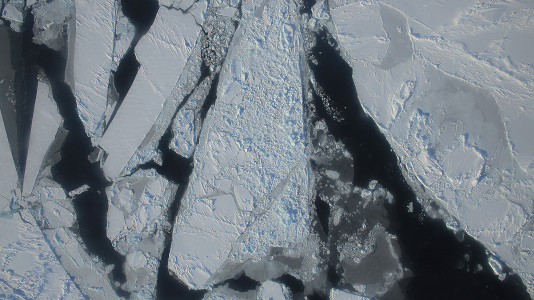
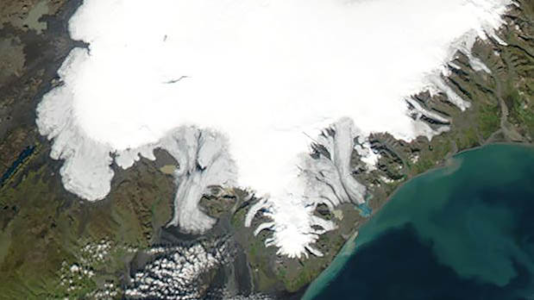
| Implements Greenland ice sheet crevasse detection over a range of years and user specified parameters. |
|
 |
|
|
| Enables users to select multiple ISMIP6 model output files for conversion to an alternate grid size. |
|
 |
Cryosphere model Comparison tool (CmCt)
|
| Coming soon! |
|
Modeling and Simulation Tools
These Jupyter-based model and simulation tools enable users to select models and simulations to run and plot, and in some tools also use observations to compare, evaluate, and plot observations and models. Users can then download the resulting high resolution plots for further analysis or presentation.
 |
|
|
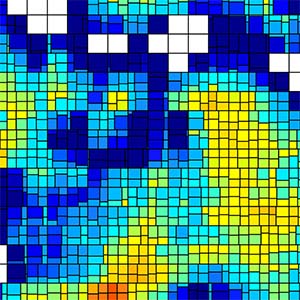
| Compares and plots user-selected attributes from MERRA-2 models of the Greenland Ice Sheet against MODIS measurements. |
|
|
 |
|
|
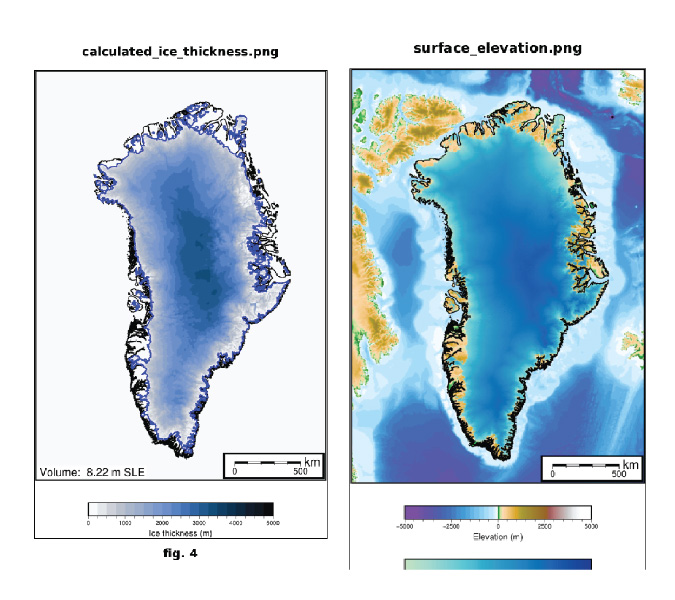
| A tool that produces paleo-ice sheet reconstructions using an assumption of steady-state, perfectly plastic ice flow behaviour described in this paper. |
|
 |
|
|
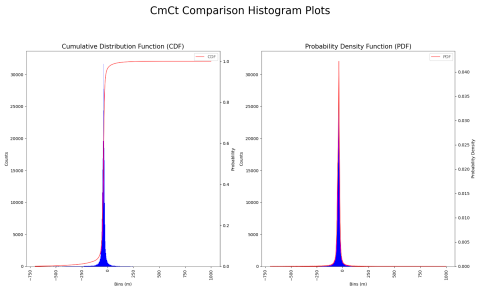
| Plots comparison result statistics from runs of the Cryosphere model Comparison tool (CmCt). |
|
 |
|
|
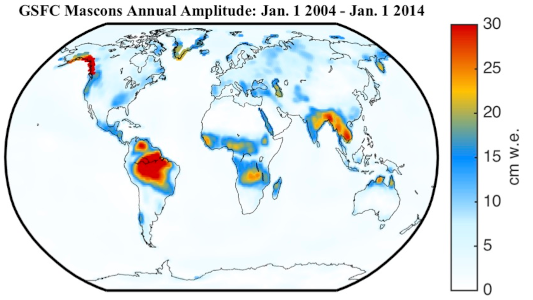
| Compares user-uploaded ice sheet models to the NASA GRACE Mascon product. |
|
 |
|
|
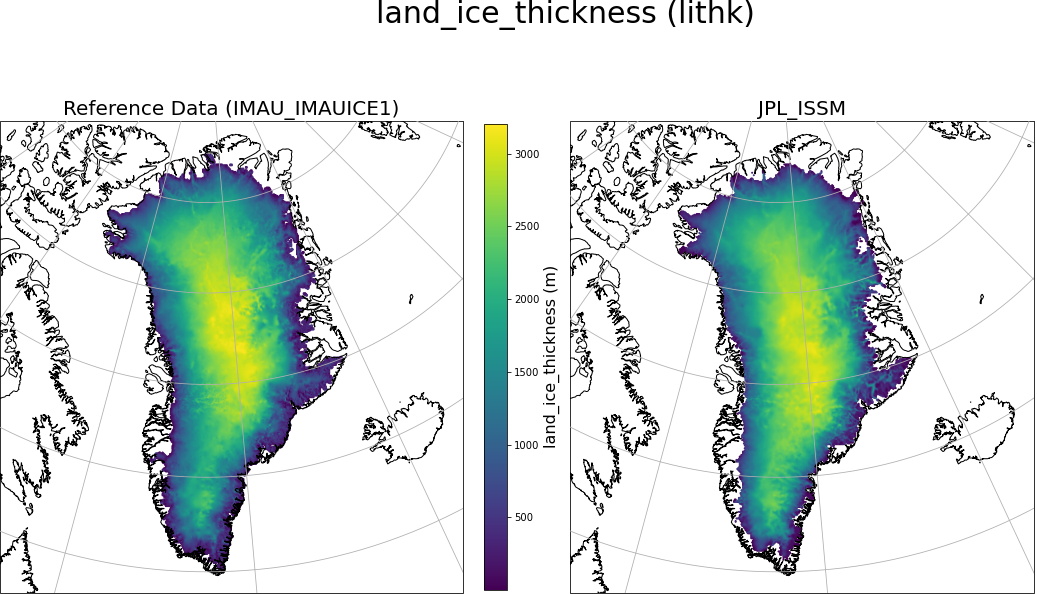
| Compares and plots ISMIP6 scalar variables from different modeling centers against a reference dataset. This is a quick quality control tool to model scalar variables and units. |
|
 |
|
|
| Notebook to create plots of global temperature from historical and projected model simulations. |
|
 |
|
|
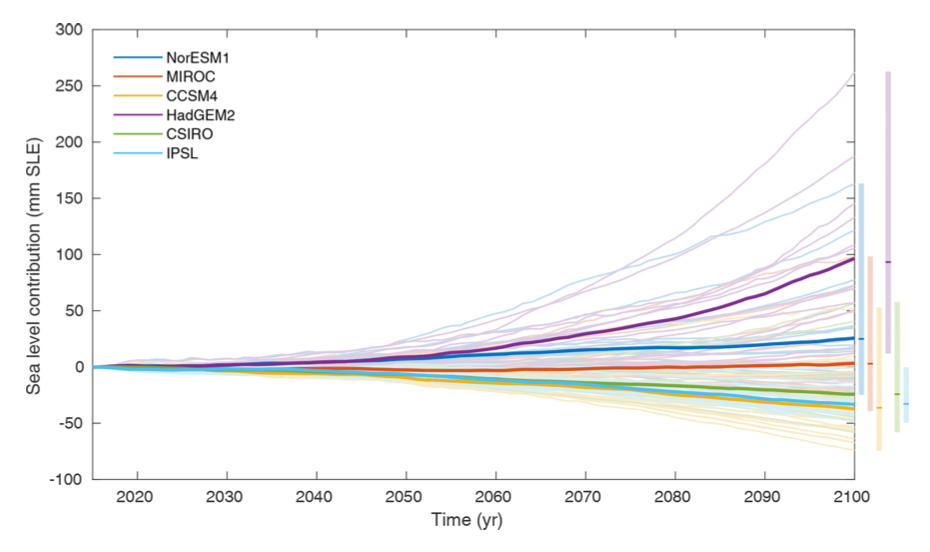
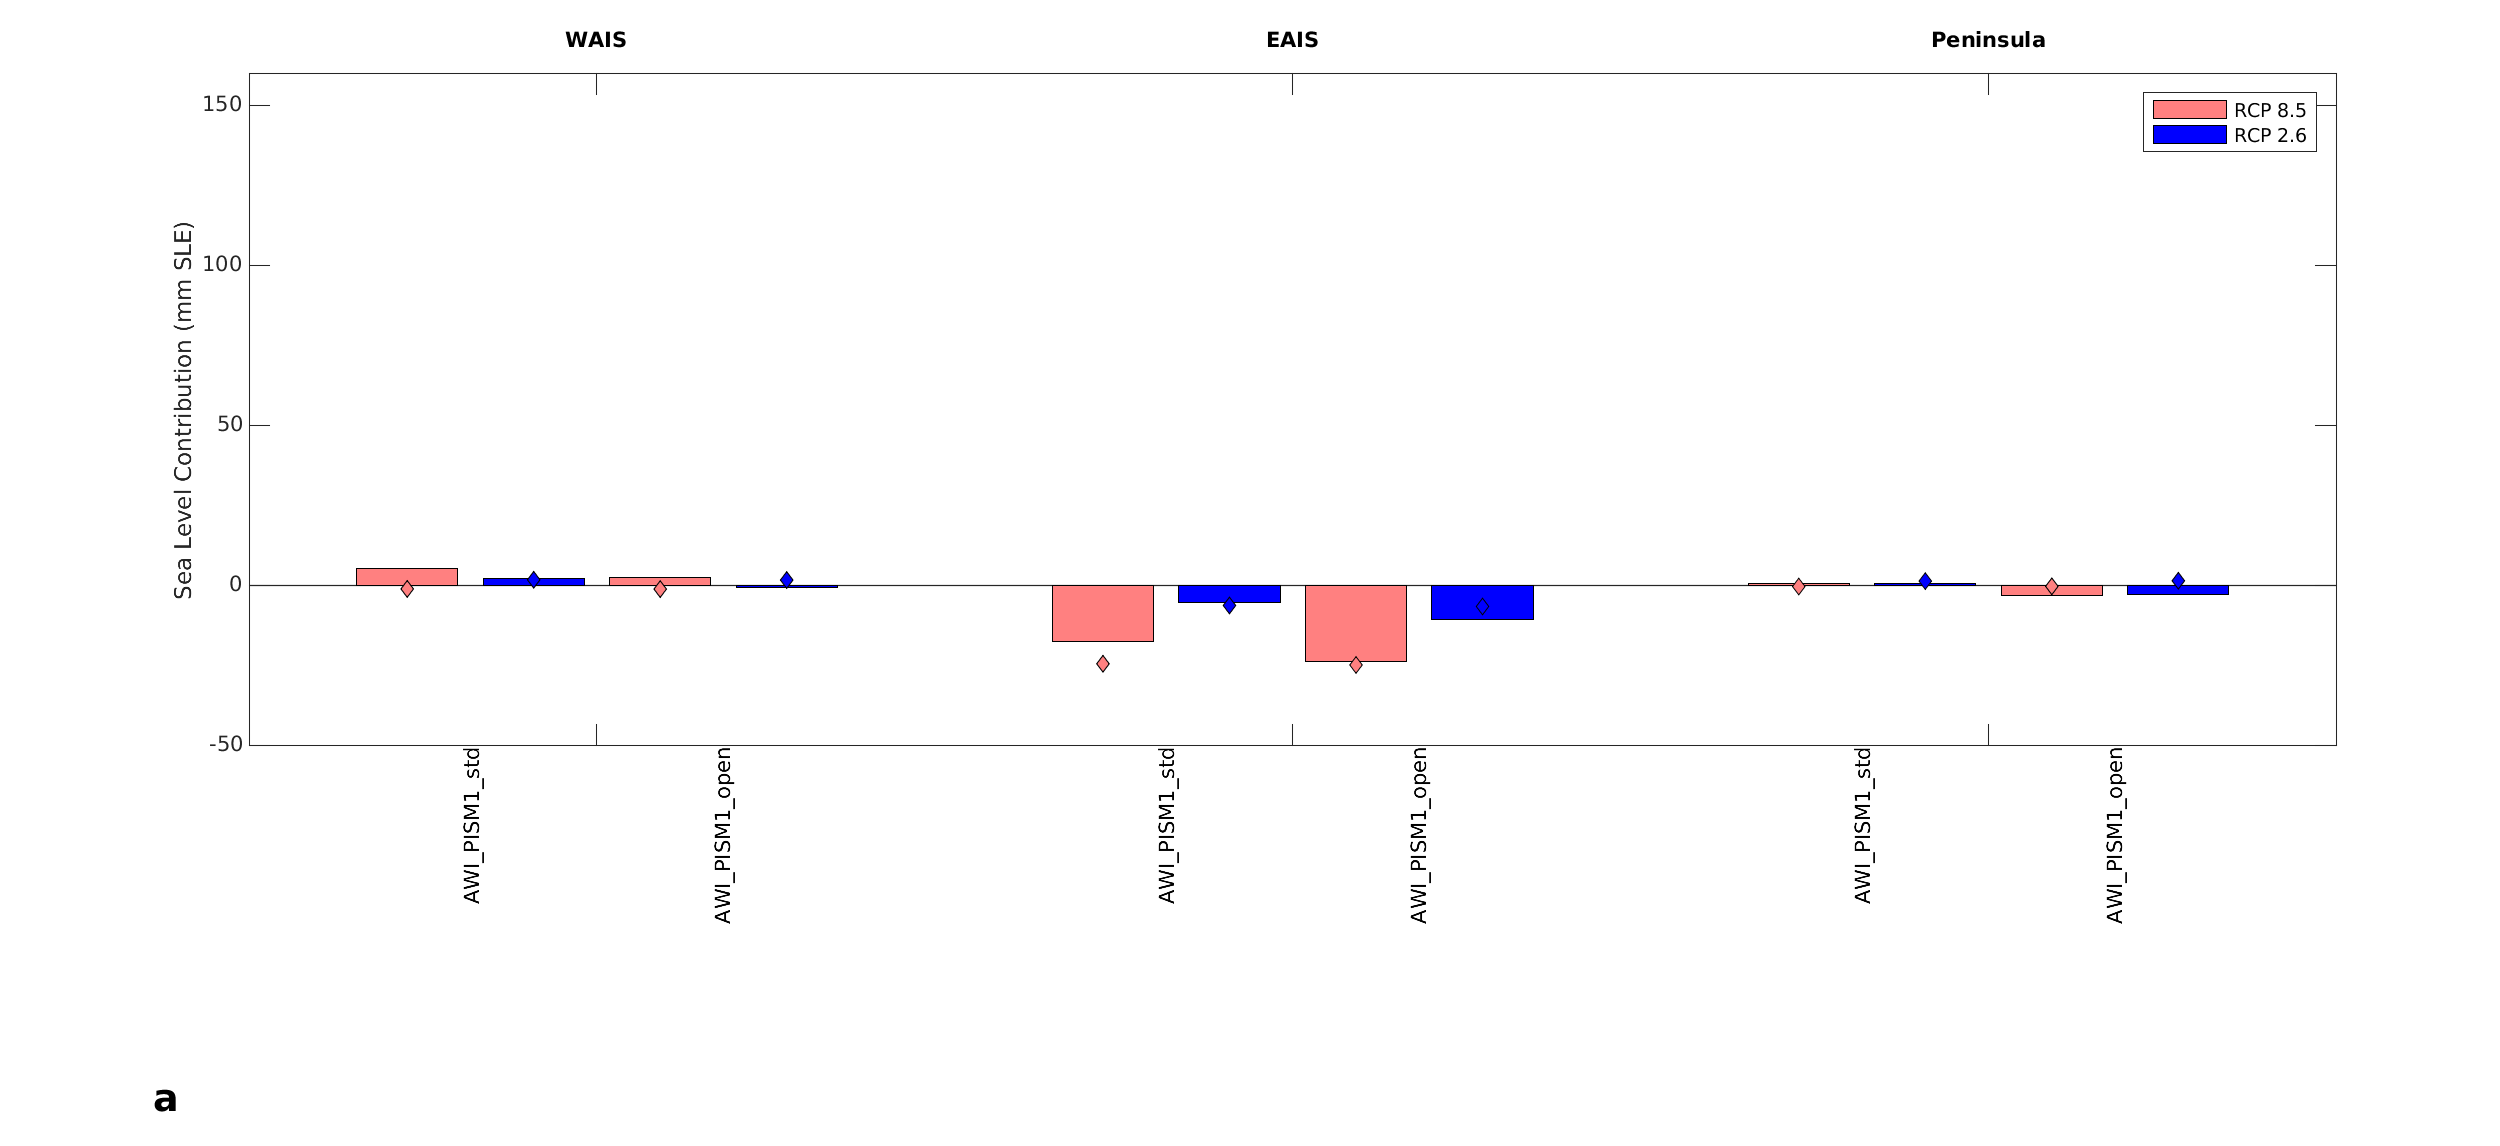
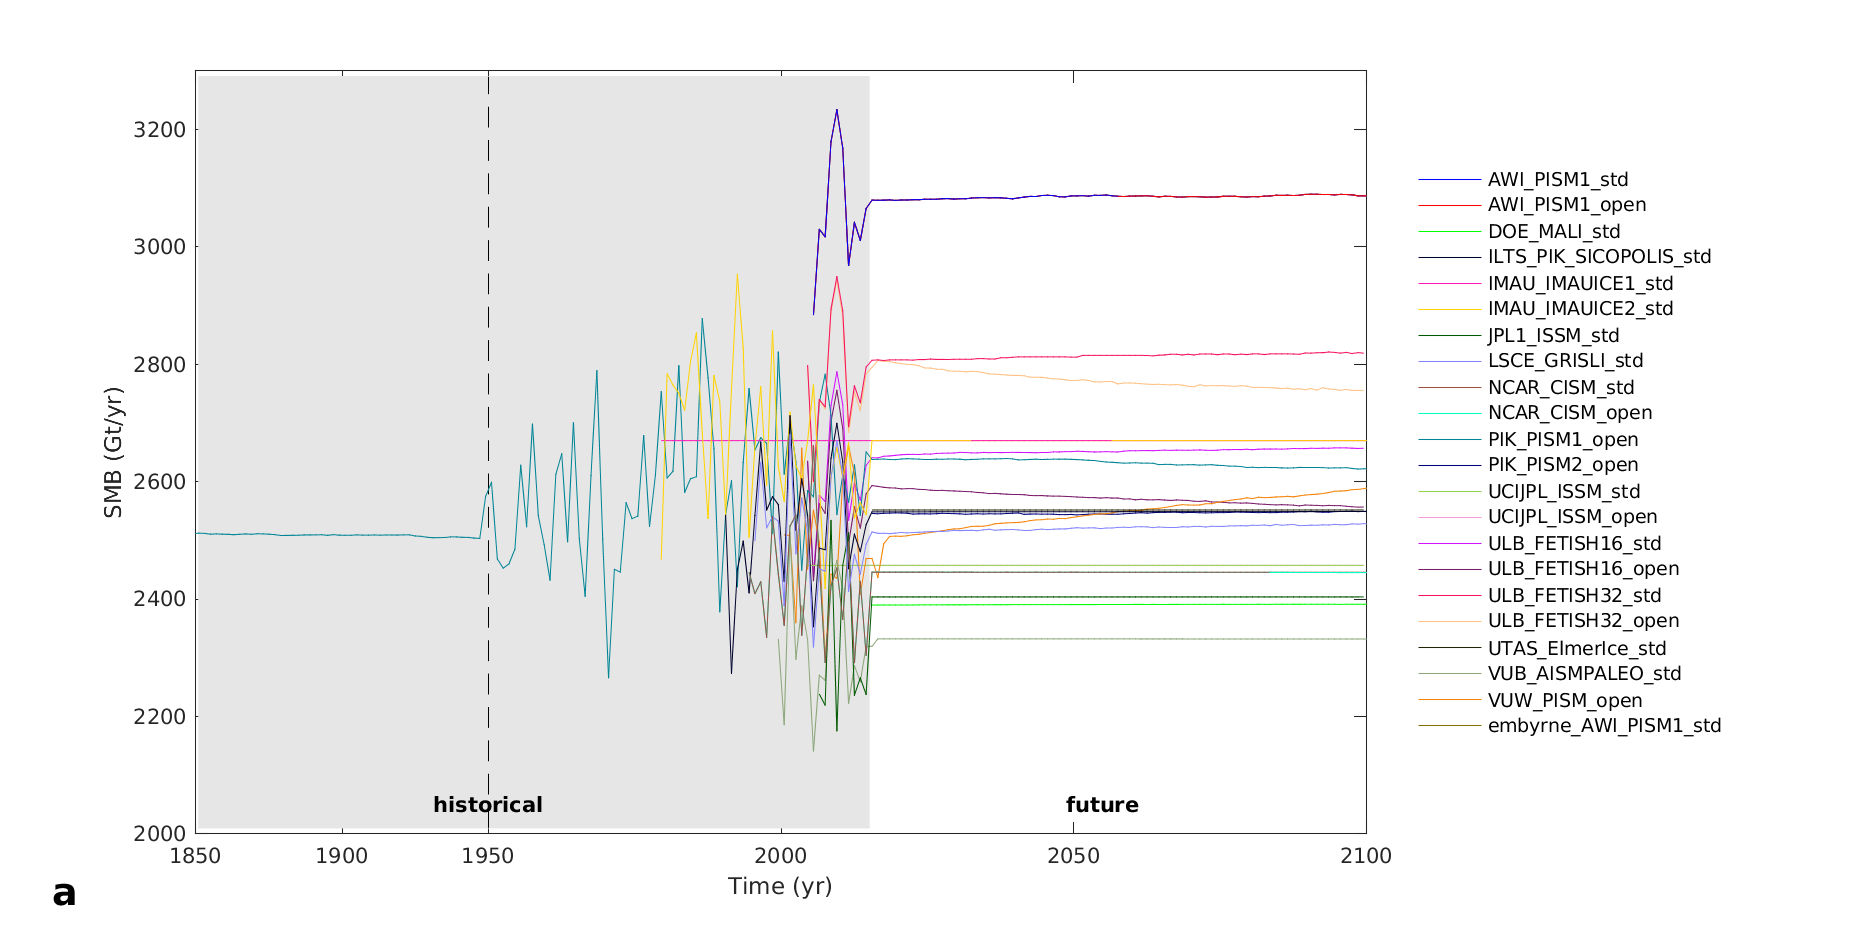
| Produces the figures from Seroussi et al. (2020) "ISMIP6 Antarctica: a multi-model ensemble of the Antarctic ice sheet evolution over the 21st century", and allows users to explore the visualizations and model outputs from this study. |
|
 |
|
|
| Extends the Visualizing ISMP6 Antartica Tool and allows users to select the Seroussi et al. (2020) model outputs used to create the figures and select the figures to create. |
|
 |
|
|
| Extends the Visualizing ISMIP6 Antartica Tool and allows users to select the Seroussi et al. (2020) model outputs used to create the figures, select the figures to create, and upload their own model datasets. |
|
 |
|
|
| Checks the compliance of ISMIP6 Greenland (GIS) and Antarctic (AIS) netCDF formatted simulation experiment files. |
|
Statistics
These tools allow users to view code or run analyses using statistical methods developed by the community.
 |
|
|
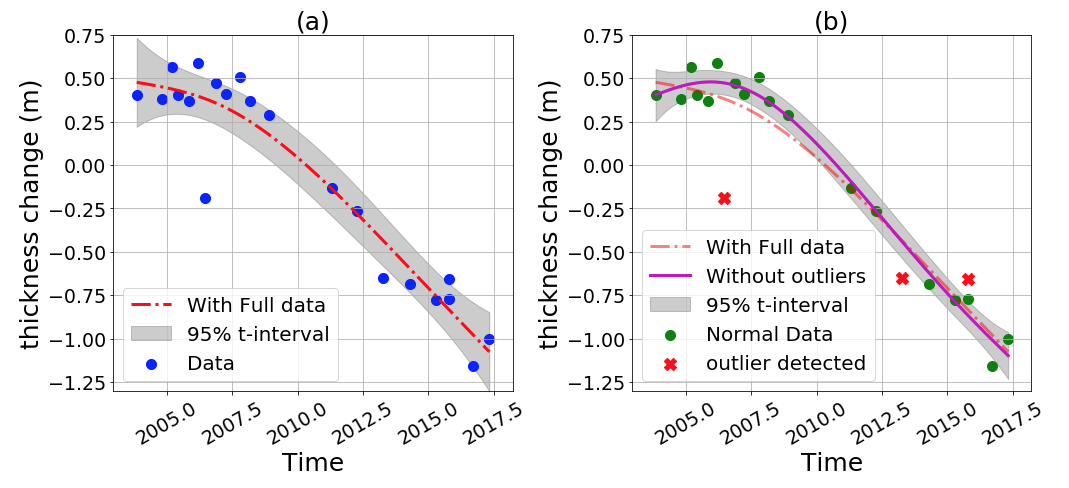
| This Jupyter Notebook approximation tool provides users the code for Approximation by Localized Penalized Splines (ALPS) framework functions. |
|
 |
|
|
| This Jupyter Book tool provides users tutorials and background information on different statistical interpolation and conditional simulation methods. |
|
Remote Sensing Analysis
These tools allow users to view code or run analyses using remote sensing analysis methods developed by the community.
 |
|
|
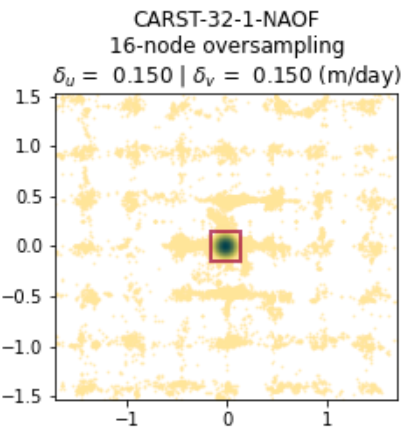
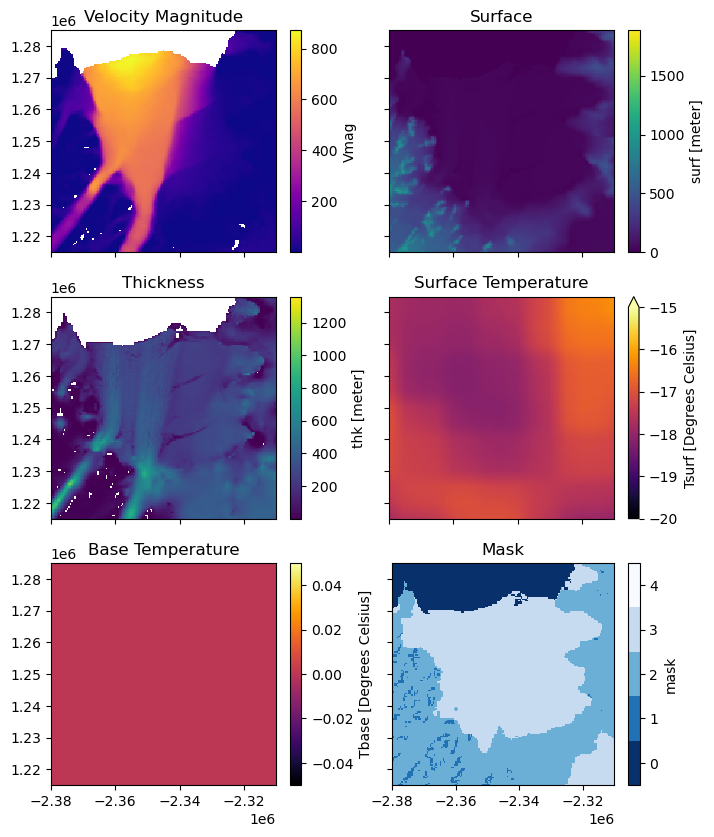
| This Jupyter Notebook tracking tool provides users the ability to assess and visualize the benchmarking metrics associated with a glacier velocity map. |
|
 |
|
|
| This Jupyter Notebook tool makes plots of crevasse penetration with six resistive stress calculations found in literature for the Larsen B remnant and Pine Island Glacier ice shelves. |
|
Code Development
These tools provide a platform for developing new Ghub tools, creating notebooks, or just running a computation.
 |
|
|
| Starts the Jupyter notebook server in the "notebooks" directory of your home directory. |
|
|
|
|
| Starts the Jupyter lab server in the "notebooks" directory of your home directory. |
|
|
|
|
| Run your own Debian 10 Linux workspace, offering compilers, scripting languages, and svn source control. |
|
 |
|
|
| Notebooks in the R language introduce computing and visualization packages and techniques. |
|
|
|
|
| Learn how to create and run Notebooks, select a kernel, design a user interface, and submit a job to the HPC cluster, from Jupyter Notebooks. |
|
 |
|
|
| This Jupyter Notebook tool provides an introductory tutorial, templates, and a guideline for creating Pegasus WMS workflow tools on Ghub. |
|
 |
|
|
| This Jupyter Book tool provides a template and a guideline for creating Jupyter Book tools on Ghub. |
|
Not registered? Join us on Ghub! Register now.