Datasets contributed by the scientific community enable users to study ISMIP6 model outputs, compare and visualize model and experimental results, and more. Some data is available through the scientific community, while other data is maintained through other agencies and groups.
Datasets available at Ghub
Several datasets are stored at University at Buffalo CCR, available for computations staged on the computing cluster and accessible using Globus APIs and portal. Others are housed on the Ghub server and are directly accessible below. For a complete list of datasets available on Ghub, go to the Resources Page.
 |
|
|
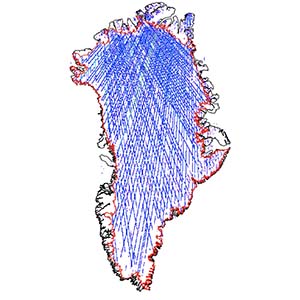
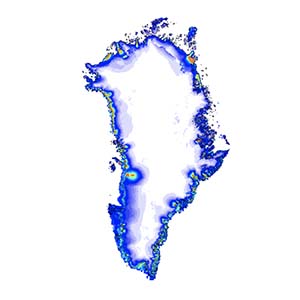
| Input altimetry data (ICESat, ERS-1/2, Envisat) processed for use with the Cryosphere model Comparison tool (CmCt), a tool that facilitates direct comparison between satellite observational data and ice sheet models. |
|
 |
|
|
| Data for the CESM ice sheet model, used for predicting ice sheet retreat and sea level rise in a warming climate. |
|
 |
|
|
| GIS-ready IceBridge ATM L2 Icessn Elevation, Slope, and Roughness data of Greenland land ice |
|
 |
|
|
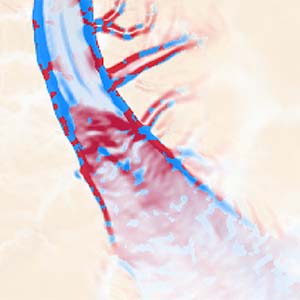
| Datasets of 2D principal strain rates and principal stresses across the surface of the Greenland Ice Sheet. |
|
 |
|
|
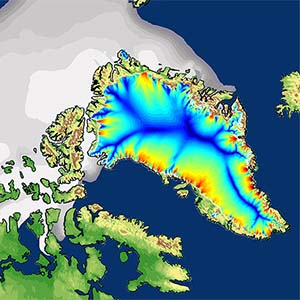
| Mass Balance and Velocity Data for Greenland's Ice Sheets at High Elevations (Thomas et al., Science, 2001). |
|
ISMIP6 Datasets available at Ghub
ISMIP6 (Ice Sheet Model Intercomparison Project for CMIP6) datasets are stored at University at Buffalo CCR, available for computations staged on the computing cluster and accessible using Globus APIs and portal.
 |
|
|
| These datasets contain the 21st century atmospheric and oceanic forcing datasets used for Greenland and Antarctic standalone ice sheet model simulations as part of the ISMIP6 project. |
|
 |
|
|
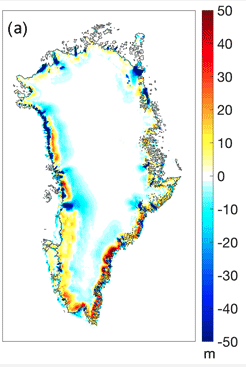
| This dataset provides the Greenland ice sheet model output produced as part of the ISMIP6 Project (Eyring et al., 2016; Nowicki et al. 2016). |
|
 |
|
|
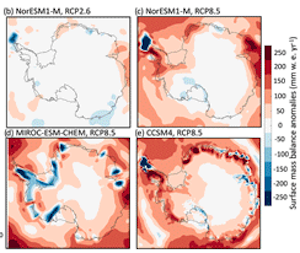
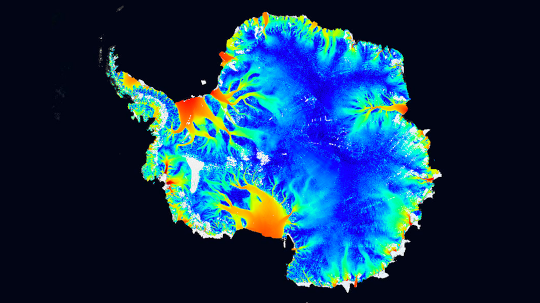
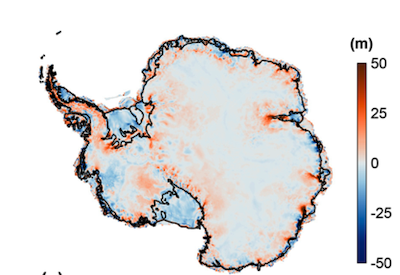
| This dataset provides the Antarctic ice sheet model output produced as part of the ISMIP6 Project (Eyring et al., 2016; Nowicki et al. 2016). |
|
 |
|
|
| This dataset contains the initMIP-Greenland model simulations from the ISMIP6 Project. |
|
 |
|
|
| This dataset contains the initMIP-Antarctica model simulations from the ISMIP6 Project. |
|
 |
|
|
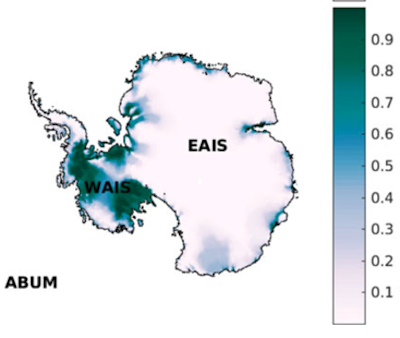
| These datasets contain the ice sheet model simulation from the ABUMIP (Antarctic BUttressing Model Intercomparison Project) effort. |
|
 |
|
|
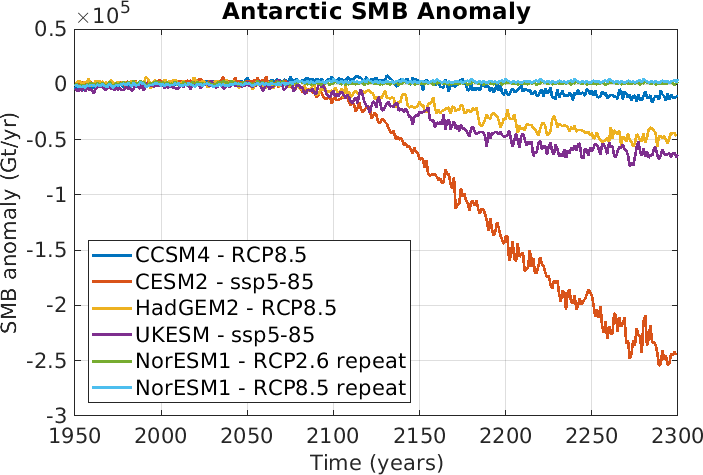
| These datasets contain the ISMIP6 23rd century forcing data that focus on simulations of the Antarctica Ice Sheet (AIS) extended to year 2300. |
|
 |
|
|
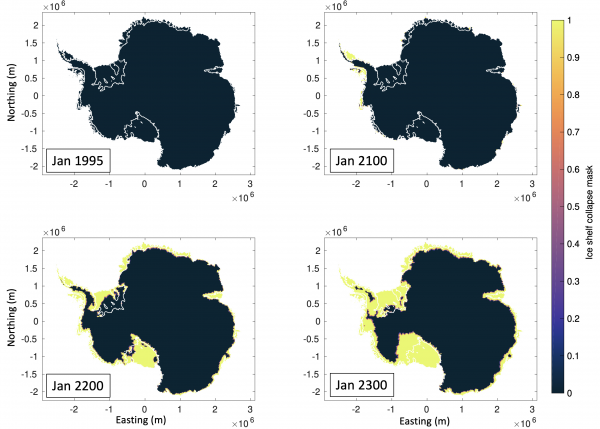
| These datasets contain the ISMIP6 23rd century projections that focus on simulations of the Antarctica Ice Sheet (AIS) extended to year 2300. |
|
Other ice sheet science datasets
Here we link to collaborators and other institutions hosting useful resources for ice sheet data.
 |
|
|
| Browse Pangeo use cases using the notebooks in this gallery. Load, analyze and plot commonly used glaciological and other datasets. |
|
 |
|
|
| Choose from hundreds of scientific data sets, focusing on the cryosphere and its interactions. These data, collected by satellites and field observations, come from NASA, NSF, NOAA, and other programs. |
|
 |
|
|
| These data are derived from natural sources such as tree rings, ice cores, corals, and ocean and lake sediments. These proxy climate data extend the archive of weather and climate information hundreds to millions of years. |
|
 |
|
|
| These data sets cover the earth's atmosphere, ocean, land and more. Explore climate indices, reanalyses and satellite data and understand their application to climate model metrics. |
|
 |
|
|
| This portal hosts NASA sea level science and interdisciplinary research tools. |
|
 |
|
|
| This dashboard's climate knowledge and technical capabilities from across ESA Member States supports research and development. |
|
|
|
|
| Here are climate data and analysis tools hosted at the National Center for Atmospheric Research. |
|
 |
|
|
| This mapping tool for research and teaching on Greenland combines datasets into a GIS analysis and visualization environment. |
|
 |
|
|
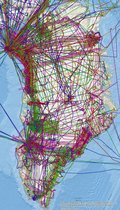
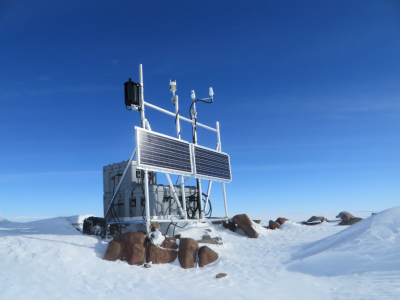
| The GNET network consists of 46 continuous GPS stations spread across Greenland to map the steady vertical velocity field associated with postglacial rebound. This data helps scientists detect and analyze abrupt changes in the rate of ice loss. |
|
Not registered? Join us on Ghub! Register now.