You must login before you can run this tool.
Category
Published on
Abstract
This tool plots a single variable from one or several ISMIP6-formatted netCDF ice sheet models for visual inspection, comparison, and download.
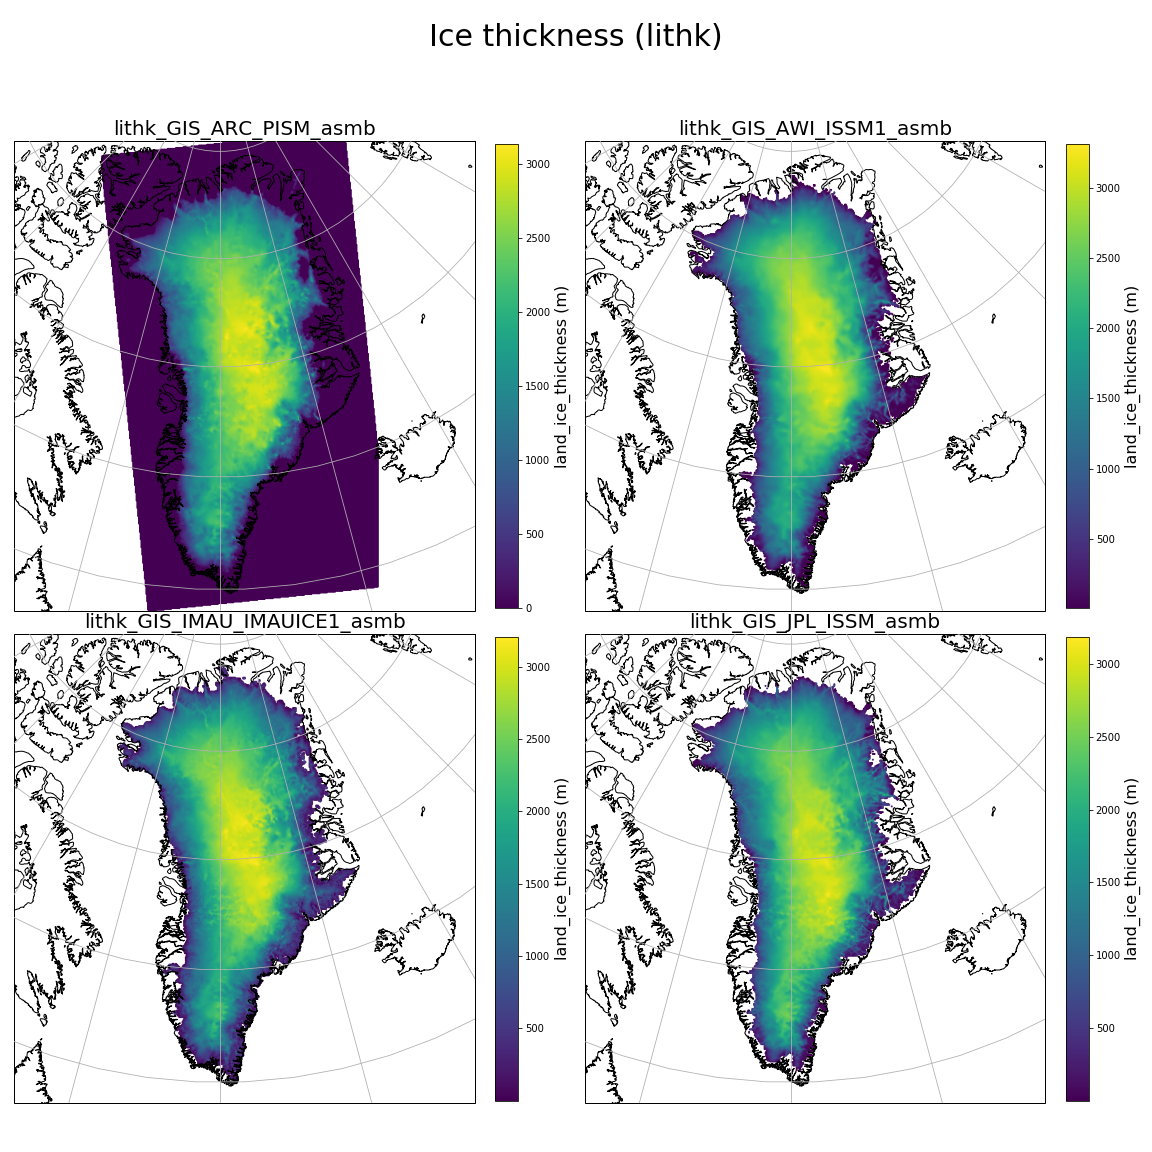
The output shows plots of the user-selected variable from each model and from a reference dataset (the IMAUICE1 ice sheet model).
Using the tool
- Click Upload Files and select netCDF ice sheet model files from your local machine.
- You may select between 1 and 6 files.
- Input files must be ISMIP6-formatted, and share a common experiment and variable name.
- Once files have uploaded:
- Select either a standard or model-based stereographic projection.
- Click Plot Data to create the output plot.
- The selected variable will be plotted for each uploaded model file and for the reference dataset.
- Click Download Plot to display a copy of the plot for download, via a popup browser window.
Tool input
Input files must be ISMIP6-formatted ice sheet models with a common experiment and variable name. Inputs may be either Greenland (GIS) or Antarctic (AIS) ice sheet models.
Input data are plotted alongside a reference dataset (the IMAUICE1 ice sheet model) for comparison.
Reference Datasets
Reference datasets are selected automatically when the tool runs. They are available for the IMAUICE ice sheet model for these ice sheets and experiments:
- Greenland: asmb, ctrl, init
- Antarctica: abmb, asmb, ctrl, init
Models that do not correspond to one of these reference datasets will not be plotted.
Projection
The user can specify the projection used: either the model projection information from the netCDF file, or using the standard definition:
    polar_stereographic
        central_latitude=90.0,
        central_longitude=-45.0,
        false_easting=0.0,
        false_northing=0.0,
        true_scale_latitude=70.0,
        globe=ccrs.Globe('WGS84')
File storage locations
- User-uploaded files are stored in the
/data/groups/ghub/tools/gisplot2directory on GHub. - Reference data used by the tool is stored in the
/data/groups/ghub/tools/referencedirectory on GHub.
File naming convention
The ISMIP6 filename provides information about its contents.
For the example file name: acabf_GIS_IMAU_IMAUICE1_init.nc
- acabf -- 2D variable name
- GIS -- Greenland Ice Sheet
- IMAU -- Modeling group name
- IMAUICE1 -- Ice sheet model name
- init -- experiment name
Tool output
The ice sheet model variables are plotted alongside the reference. This output plot is shown directly in the notebook, and stored in png format in the /data/groups/ghub/tools/gisplot2 directory on GHub. The Download Plot button can be used to download the output plot to your local machine. For a successful download, please enable popups in your browser window.
Example output
A sample set of output plots are shown. Here, the ice thickness variable is plotted for three user-supplied models of the Greenland ice sheet, and a reference dataset.

Python Libraries
import os, sys, io, shutil
import warnings
import numpy
import xarray
import matplotlib
import cartopy
import ipywidgets
import hublib.ui
import math
import collections
Cite this work
Researchers should cite this work as follows:
- Simon, E., Nowicki, S., Snitzer, E., & Sperhac, J. (2021). ISMIP6 Ice Sheet Model Comparison Tool (1.6). The Ghub. https://doi.org/10.5281/zenodo.11086156