Table of contents
1. Introduction
BET models are a set of probabilistic tools aiming to provide probabilistic estimation of volcanic unrest, of eruption, and of any hazardous phenomena linked to volcanic activity. For this reason, they can be used for probabilistic forecasting during crisis of unrest (short-term) and/or more comprehensive probabilistic volcanic hazard assessments (PVHA). The background theory of these models is based on the definition of ad-hoc Bayesian event trees, where each node is treated through a Bayesian inference approach. This approach allows to merge together different kind of available information, as theoretical/empirical models, a-priori beliefs, past data and monitoring data (the latter for short-term analysis).
Here we present some of the current software implementations of these models, with the specific goal of providing a user-friendly interface to the final users. The softwares have been developed by using the Python programming language, since the broad compatibility of Python allows to install them on all the most common operating systems (Linux, Mac OSX, Windows) and also on the VHub cyber-infrastructure, where they can be freely run online or downloaded. In the next sub-sections they are briefly introduced.
More details on the BET’s models background theory can be found in literature (among others see Marzocchi et al., 2004; Marzocchi et al., 2008, Marzocchi et al., 2010) and are out of the scope of this document. However, some basic principles will be briefly introduced in the next section 2, in order to properly approach the use of the corresponding tools.
1.1 PyBetVH
PyBetVH is a completely new, free, open-source and cross-platform software implementation of the Bayesian Event Tree for Volcanic Hazard (BET_VH). The purpose of the tool is to provide a graphical support to BET_VH model, which estimates the long-term probability of any magmatic hazardous phenomenon (i.e., lava flows, tephra fall, pyroclastic flows, lahars, etc.) occurring in a selected time frame, accounting for all the uncertainties. The BET_VH model represents a flexible tool to provide probabilities of any specific event at which we are interested in, by merging all the available information, such as theoretical models, a priori beliefs, and past data. It is mainly based on the Bayesian inference and it deals with long-term forecasting only, therefore it can be useful in land use planning. More details can be found in Marzocchi et al. (2010) and it has been used in several applications (Selva et al., 2010; Sandri et al., 2012; Sandri et al., 2014; Thompson et al., 2015; Tonini et al., 2015b)
PyBetVH calculates hazard curves, which describe the distribution of the exceedance probability as a function of a user-selected intensity measure (e.g., tephra load) on a grid of points covering the target area. The computed hazard curves are (i) absolute (accounting for the probability of eruption in a given time frame, and for all the possible vent locations and eruptive sizes) and (ii) Bayesian (computed at different percentiles, in order to quantify the epistemic uncertainty). Such curves allow representation of the full information resulting from PVHA, and are well suited to become a main input to quantitative risk analyses. PyBetVH allows for interactive visualization of both the computed hazard curves, and the corresponding Bayesian hazard/probability maps. PyBetVH is designed to minimize the efforts of end users, making PVHA results accessible to people who may be less experienced in probabilistic methodologies, e.g. decision makers.
More details on PyBetVH tool and can be found in Tonini et al. (2015a), where the use of the tool is illustrated through the example of PVHA for tephra fallout from the Okataina Volcanic Centre (OVC), New Zealand, by highlight the range of outputs that the tool can generate.
1.2 PyBetEF
PyBetEF is an open and cross-platform implementation of BET_EF (Bayesian Event Tree for Eruption Forecasting) equipped with a Graphical User Interface. BET_EF model aims to provide probabilities of unrest/eruption forecasting of magmatic events, by merging all the relevant available information such as theoretical models, a priori beliefs, monitoring measures, and any kind of past data. BET_EF is based on a Bayesian procedure and it relies on the fuzzy approach to manage monitoring data. The method deals with short- and long-term forecasting; therefore, it can be useful in many practical aspects such as land use planning and volcanic emergencies (Marzocchi et al., 2008). BET_EF model has been applied to several volcanic systems (Marzocchi et al., 2008; Sandri et al., 2012; Selva et al., 2012a; Selva et al., 2012b).
1.3 PyBetUnrest
PyBetUnrest is an open and cross-platform implementation of BET_UNREST model. BET_UNREST is an extension of BET_EF including non-magmatic volcanic unrest and its relating hazardous phenomena, by adding a specific branch to the event tree (Rouwet et al., 2014). It has been designed and developed as one of the final products of the EU VUELCO project and tested during the last volcanic crisis simulation organized in Dominica (West Indies) in the frame of VUELCO (Sandri et al., Under review).
>>>This tool is currently under final testing for VHub and relating publications are still in preparation/under review
2. Background Theory
The main concepts behind BET models are the definition of an event tree (ET, hereafter) and the use of the Bayesian inference. ET is a tree graph representation of events in which individual branches are alternative steps from a general prior event, state, or condition through increasingly specific subsequent events (intermediate outcomes) to final outcomes (see Figure 1). In this way, an ET shows all relevant possible outcomes of volcanic unrest at progressively higher degrees of detail. The branches at each node represent different possible events, although these need not be mutually exclusive or exhaustive. The Bayesian approach is used at the different nodes to merge theoretical models of the eruptive process, past (historical and geological) data, and, for short-term forecasting, data from monitoring of the volcano. Thus it allows to formally account for both aleatoric (due to the intrinsic randomness of the system) and epistemic (due to limited data or knowledge) uncertainties. Through the ET, one can calculate both absolute and conditional probability. This corresponds to consider the selected full path or just a single node in the ET itself.
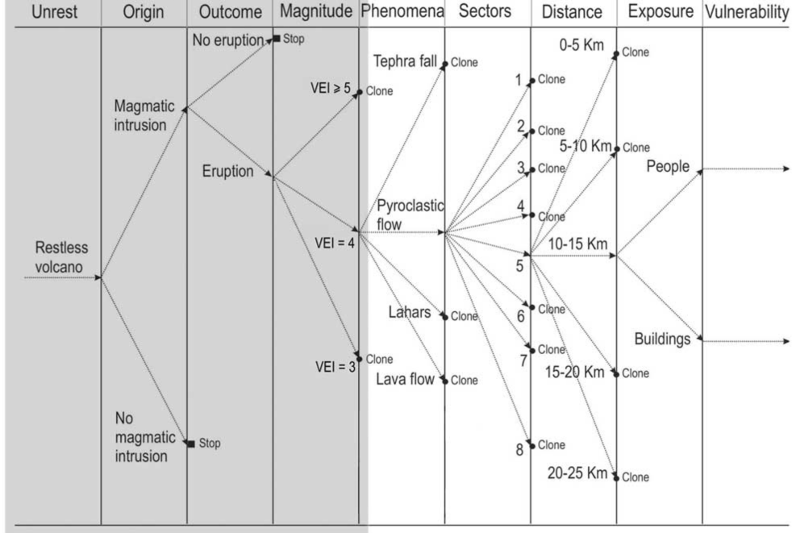
Figure 1: Example of event tree as designed after Marzocchiet al. (2004) for Mount Vesuvius.
2.1 Bayesian Inference
The Bayesian methodology allows to include a formal probabilistic treatment of the available data and their uncertainties and each node of the event tree is represented by a probability density function (pdf). Each node is assigned a probability by means of a Bayesian approach, meaning that a prior probability distribution (usually coming from theoretical models) and information from past data are statistically combined together to obtain a posterior probability. Quantities are estimated by considering all the available information (analytical/empirical models, expert beliefs, data) as described in the following formulation (see also Figure 2):
$$[\theta | data]$$ ∝ $$[\theta][data | \theta]$$
where:
- $$[\theta]$$ is the prior distribution (subjective beliefs about a parameter))
- $$[data | \theta]$$ is the likelihood distribution (available data)
- $$[\theta | data]$$ is the posterior distribution (updated beliefs after having observed data)
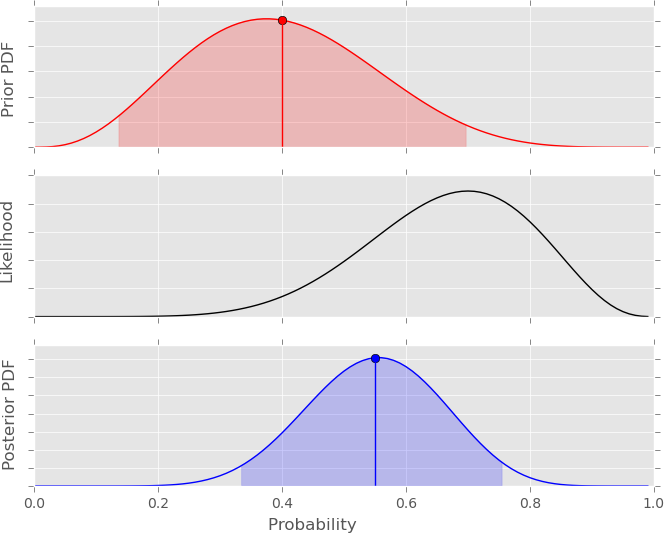
Figure 2: Bayesian inference: posterior distribution as result of prior model updated through available observed data.
The nature of the Bayesian analysis procedure can be summarized by the following practical concepts:
- If the prior is uninformative, the posterior is very much determined by the data (the posterior is data-driven)
- If the prior is informative, the posterior is a mixture of the prior and the data
- The more informative the prior, the more data you need to change your beliefs
2.2 Monitoring
Monitoring data are accounted by identifying all the monitored parameters that can provide information about a degree of anomaly at each node of the ET. The degrees of anomaly of each measure is computed in two ways (see Figure 3 here below): the parameter’s anomaly can be defined as binary (exceedance of one threshold), as shown in the left panel of Figure 3, or through a fuzzy approach (by defining two thresholds), as shown in the right panel of Figure 3.
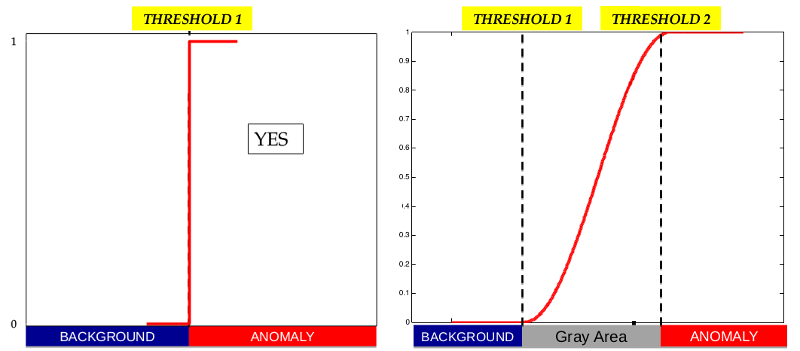
Figure 3: Definition of parameters’ thresholds
Once a number of monitoring parameters have been identified and the corresponding thresholds defined, it is possible to compute the observed degree of anomaly any time new data are available. Given a level of observed anomalies Z we estimate the probability of unrest or magmatic unrest or eruption through the following formulation:
H = – ln(1-P) = -(a′ – bZ)
P = 1 – a * exp(-bZ)
The parameter a’ and b can be defined for any volcanic systems, since their meaning is strictly connected to specific configuration of the local monitoring network and the expert’s beliefs on the selected volcano.
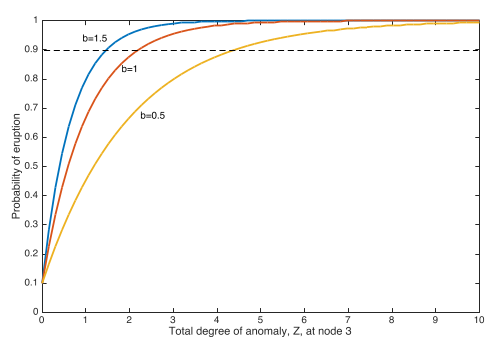
Figure 4:
The parameter a′ (intercept with the y axis) is set from 1-a that is the probability that the event occurs when we observe Z=0 (no anomalies). It must be larger for weakly monitored volcanoes, and smaller for well monitored volcanoes. The default for a′ derives from setting 1-a=0.1 (at node 3, this means that there could be an eruption when we do not observe any anomaly at the node).
The parameter b (steepness of the curve) is set defining what is the value of Z for which I am almost sure that the event occurs. The default is b=1 (about 90%).
To define anomalies at each node (parameters, thresholds and weights);
Z = ∑ zi wi
where zi is the anomaly for parameter i and ωi the weight given at parameter i.
3. Local Installation Requirements
All PyBet tools require Python and some Python third party modules/libraries which need to be installed in order to be able to run the tools. The first step is to check if the Python interpreter is installed. By typing “python” in a terminal window followed by the Enter key, the prompt should give a similar response:
rob@robelix:~$ python
Python 2.7.3 (default, Apr 20 2012, 22:39:59)
[GCC 4.6.3] on linux2
Type "help", "copyright", "credits" or "license" for more information.
>>>
The required additional modules/libraries are:
- wxPython (graphical user interface library)
- Numpy (scientific computing library)
- Matplotlib (2D plotting library)
- Pillow (a fork of the former Python Image library)
All of them are open source and freely available and usable for all the most common operating systems (Linux, Mac OSX and Windows). Depending on the operating system and on the experience of the user in using its machine and/or Python, the procedure to install these libraries can be approached in different ways.
3.1 Linux
In the majority of Linux distributions, Python libraries can be easily installed by means of their own package managers, which install, update, remove softwares in the system in a consistent manner, by checking for all the required dependencies and shared libraries. For Debian-like distributions, you can use the synaptic tool or simply the following command from the terminal:
sudo apt-get install python-numpy python-matplotlib python-wxgtk3.0 python-pil
The procedure for other distributions is very similar.
3.2 Mac OSX/Windows
Both these operating systems do not have a native package manager to handle libraries and softwares in a smart way as Linux distribution, so the installation of Python libraries could not be so straightforward. One can download and install the single libraries from the respective web sites, being very careful to the Python Standard Library version installed on his/her own computer as reference to choose the correct files. Moreover, Mac OSX users can try to use MacPorts (https://www.macports.org/) or Homebrew (http://brew.sh/), depending on their own expertise in using these tools, which should play as package managers similarly to the ones available for Linux systems. Alternatively, as easiest way, one can install the Enthought Canopy free version https://store.enthought.com. Canopy is a very rich Python package distribution, which will install a scientific Python environment in your system. It is less flexible, but more solid and it takes care of the compatibility among all the libraries. Once you have installed Canopy (as any other software in your own operating system), one should set the Canopy Python environment as the default Python. Official instruction can be found for Windows and Mac OSX.
Note for Mac OSX users: if the above procedure does not set the Python Canopy environment as your default Python, you can manually set your .bash_profile as follows:
export PATH=/Users/$YOURUSERNAME/Library/Enthought/Canopy_64bit/User/bin:$PATH
When Canopy is set as your default Python environment, by running the python command from your terminal, you should get something similar:
macosx@macuser:~$ python
Enthought Canopy Python 2.7.9 | 64-bit | (default, Jun 30 2015, 19:41:21)
[GCC 4.2.1 (Based on Apple Inc. build 5658) (LLVM build 2335.6)] on darwin
Type "help", "copyright", "credits" or "license" for more information.
>>>
3.3 Requirements verification
Independently on the operating system you are using and on the method used to install these Python libraries, their correct installation can be verified by entering in the Python interactive shell and manually importing the libraries:
rob@robelix:~$ python
Python 2.7.3 (default, Apr 20 2012, 22:39:59)
[GCC 4.6.3] on linux2
Type "help", "copyright", "credits" or "license" for more information.
>>> import numpy
>>> import matplotlib
>>> import wx
>>> from PIL import Image
If the previous requirements are satisfied, you can proceed with the installation of the tool(s) on your system.
4. Running the tools
4.1 PyBetVH
Download the source code from the PyBetVH main page on the VHub web site (Download does not require to be registered users). Under the launch tool button on the right, by clicking on download, it will be asked to save a compressed file (betvh-rxxx.tar.gz). The archive must be placed in a folder where the user has full permissions (reading, writing and executing) on files. This will be the installation folder of PyBetVH and should not be moved anymore. After having extracted the files from the tar.gz file, the following folder tree structure should appear:
rob@robelix:downloads$ ls -hot betvh-rxxx
total 68K
drwxr-xr-x 2 rob 4.0K Jan  8 22:04 bin
drwxr-xr-x 2 rob 4.0K Jan  8 22:02 src
drwxr-xr-x 2 rob 4.0K Nov  9 19:01 data
drwxr-xr-x 3 rob 4.0K Nov  9 19:01 doc
drwxr-xr-x 3 rob 4.0K Nov  9 19:01 examples
drwxr-xr-x 2 rob 4.0K Nov  9 19:01 middleware
drwxr-xr-x 2 rob 4.0K Nov  9 19:01 rappture
-rw-r--r-- 1 rob  723 Nov  9 19:01 LICENSE.txt
-rw-r--r-- 1 rob  35K Nov  8 16:56 COPYING
This is the structure required by VHub repository. After having opened a terminal window and moved into src/ folder, it must be executed the following command:
rob@robelix:betvh-rxxx$ make install all
The command above installs all the executable files in the bin/ directory. Open a terminal and move inside the bin/ folder:
rob@robelix:~$ cd /yourpath/betvh-rxxx/bin
You can now launch the tool with:
rob@robelix:~$ python betvh.py
Depending on your operating system, you can now set a link to the main executable, which is in /yourpath/betvh-rxxx/bin/betvh.py. For example, in Linux and Mac OSX platforms:
rob@robelix:~$ chmod u+x /yourpath/betvh-rxxx/bin/betvh.py
rob@robelix:~$ ln -s /yourpath/betvh-rxxx/bin/betvh.py /somewhereinyourPATH/PyBetVH
Finally, if all the operations above have been successfully concluded, the tool can be launched by simply doing, from any position in your file system, in the terminal window:
rob@robelix:~$ PyBetVH
4.2 PyBetEF
PyBetEF is not yet installed on VHub. You can download it from here together with a working example. Uncompress the .zip file and place the whole folder where you prefer. The folder contains the PyBetEF main program and all the modules needed to be properly executed. The user should not modify, remove or do any change to this folder, since the risk is to compromise the functionality of the tool. The tool is ready to be launched for a first trial. Open a terminal and move inside the folder containing the PyBetEF source files:
rob@robelix:~$ cd /your/path/to/PyBetEF/folder/
then launch the tool:
rob@robelix:~$ python PyBetEF.py
There are several ways to make this operation faster. In Linux and Mac OSX systems, as illustrative example, one can make the PyBetEF.py main program file executable and then create a (symbolic) link to it in a folder belonging to its PATH environment variable:
rob@robelix:~$ chmod u+x /yourpath/PyBetEF/PyBetEF.py
rob@robelix:~$ ln -s /yourpath/PyBetEF/PyBetEF.py /somewhereinyourPATH/PyBetEF
In this way one should be able to run the tool from any place of her/his filesystem by opening a terminal and simply doing:
rob@robelix:~$ PyBetEF
In Windows one can create a link (i.e., on the Desktop) by clicking with the mouse’s right button ans selecting create a link. Then double click on the link should directly launch the tool.
In order to run the example, you have to unzip the file and place the FakeVolcano folder wherever in your file system. The folder contains the input files to run PyBetEF. Instructions on how to prepare the input files are given in Input preparation section. The next step is to launch the tool, click on Load Volcano button in the upper left panel and select the FakeVolcano folder. If everything went fine, the event tree defined for this example is loaded in the lower left panel and the user can explore it by clicking on the nodes. Once the desired node is selected, the user can press the COMPUTE button on the lower right panel. A new window frame will be opened, visualizing the corresponding output.
4.3 PyBetUnrest
The procedure is the same shown in 3.1 for PyBetVH
5. Input preparation
Input to feed PyBet tools consists in a set of text files organized in a main folder representing the volcano in which the user is interested in. The main input information is driven by a configuration file called pybet.cfg, which must always exist in order to run the codes. This file is a simple text file in which the user can input the general information about the volcano, and must be formatted as shown in the example below. The user should not change the names of the various blocks (identified by square brackets) and neither the field tags that are to the left of the sign ‘=’, but only fill in the spaces on its right (for instance, in the block “Main Settings”, the tag “volcano name” is the variable name and cannot be changed, while on the right the user can set the values for the desired case study).
5.1 PyBetVH
Many details on input preparation to PyBetVH can be found in Tonini et al. (2015) main paper and in the relating supplementary material.
5.2 PyBetEF
Example of pybet.cfg
[Main Settings]
volcano name = Fake Volcano
volcano center = 562164, 5115607
shape = Cone
geometry = 1000, 5000, 45
utm zone = 10T
time window = 1
sampling = 1000
background image = filename/None
map limits (m UTM) = 555000, 570000, 5108000, 5123000
monitoring = filename/None
anomaly function parameters = 0.1, 1.0, 1.0

[Node Unrest]
prior probability = 0.5
equivalent n. data (lambda) = 1
past data (successes) = 0
past data (total) = 0

[Node Magmatic]
prior probability = 0.5
equivalent n. data (lambda) = 1
past data (successes) = 0
past data (total) = 0

[Node Magmatic Eruption]
prior probability = 0.5
equivalent n. data (lambda) = 1
past data (successes) = 0
past data (total) = 0

[Node Magmatic Vent Location]
file name = node_vent.txt
equivalent n. data (lambda) = 1
file name monitoring = node_vent_monitoring.txt/None

[Node Magmatic Style]
node 4-5 dependence = False
n. sizes = 4
file name = node_style.txt
- Block “Main Settings”
- “volcano name =”: the user should add volcano name
- “volcano center =”: the user should add longitude and latitude in UTM coordinates (meters),
- “shape =”: this allows to select the geometry of the possible vent positions. Please add the keyword “Field” for a volcanic field or a caldera, corresponding to a rectangular grid of possible vent locations, or “Cone” for a central geometry characterized by a central vent position over the summit crater area, and 4 lateral sectors
- “geometry =”:
- if the geometry “Field” is selected in the previous line, the user should input 5 values (comma separated): the along-longitude length (in meters) of the field, the along-latitude length (in meters) of the field, the number of columns (Nc) to divide the field along the longitude, the number of rows (Nr) to divide the field along the latitude, and the strike (in decimal degrees) from North;
- if the geometry “Cone” is selected in the previous line, the user should input 3 values (comma separated): the radius of the central vent position above the summit crater area (in meters), the outer radius (to the apron) of the volcano edifice (in meters), the strike (in decimal degrees) from North to rotate clockwise the four 90-degrees outer sectors;
- “utm zone =”: the user should add the UTM zone together with the hemisphere, N=North or S=South (i.e, 33N or 18S)
- “time window =”: the user should add a number that will determine the exposure time. For example, if the user wants to perform an assesment for a 1 year exposure time, he must input the value “1” here, and keep in mind that time unit is years
- “sampling =”: the user should add the number of samples that PyBetEF will draw at each node of the event tree to assess epistemic uncertainty. Acceptable values (compromise between accuracy and runtime) are between 400 and 2000, but the user could insert any value (integer).
- “background map =”: the user should enter a name of file (in png format) containing the background image to be overlain by contour hazard maps or probability map. If keyword “None” is provided, the tool will try to connect to the web and download a map from Google Maps based on the limits provided in the next item. A good practice could be to let the tool downloading a map from Google Maps the first time, then inserting here the filename of the downloaded map for the further runs of the tool (the current PyBetEF version can load .png image format only).
- “map limits =”: the user should provide SW and NE corners of the background map in UTM coordinates (m).
- “monitoring =”: the user should provide file name where monitoring parameters are set.
- “anomaly function parameters =”: a, b, lambda
- Block “Node Unrest” (Node 1)
- “prior probability =”: the user should input the prior probability value (a number between 0 and 1) for the volcano entering unrest (see Marzocchi et al 2008; 2010 for more details)
- “equivalent n. data (lambda) =”: the user should input a number expressing how much he is confident on the prior probability. This number represents a fictitious number of data he would like to collect before changing significantly his mind on that prior guess. Possible values range from 1 (very low confidence on the prior probability value) to (theoretically) infinite; however, a value of 50 implies already a very high confidence on the prior probability value. Please note that the combination “prior probability = 0.5” and “equivalent n. data (lambda) = 1” expresses the maximum ignorance probability distribution (uniform distribution on the domain !0,1!)
- “past data (successes) =”: the user should input the number of observed unrest episodes in the available record (that must be complete, meaning that it is reasonable to assume that no unrest has been lost over that time period covered by the record).
- “past data (total) =”: the user should input the number of observed time windows, in the time unit defined in the block “Main Settings” (in the above example, the number of time windows of 1 year), beginning in a state of NO UNREST. The user should discard the time windows where there was already unrest from the beginning
- Block “Node Magmatic” (Node 2)
- “prior probability =”: the user should input the conditional prior probability value (a number between 0 and 1) of the unrest being due to active magma, given unrest (see Marzocchi et al 2008; 2010 for more details)
- “equivalent n. data (lambda) =”: as above but related to the prior probability of magmatic unrest
- “past data (successes) =”: the user should input the number of unrest episodes of known magmatic origin in the complete record
- “past data (total) =”: the user should input the number of unrest episodes of known origin (magmatic, hydrothermal, tectonic) in the complete record
- Block “Node Magmatic Eruption” (Node 3)
- “prior probability =”: the user should input the conditional prior probability value (a number between 0 and 1) of the magmatic unrest leading to eruption, given magmatic unrest (see Marzocchi et al 2008; 2010 for more details)
- “equivalent n. data (lambda) =”: as above but related to the prior probability of magmatic unrest leading to eruption
- “past data (successes) =”: the user should input the number of magmatic unrest episodes having led to an eruption in the complete record
- “past data (total) =”: the user should input the number of magmatic unrest episodes in the complete record
- Block “Node Magmatic Vent Location” (Node 4)
- “file name =”: the user should input the name of the text file in which the prior spatial probability of vent opening, and past occurrences at each vent position, are stored (e.g., “node4.txt”, see below for its structure).
- “equivalent n. data (lambda) =”: as above, but related to the prior spatial probability of vent opening
- Block “Node Magmatic Style” (Node 5)
- “node 4-5 dependence =”: the user should input “False” (if there is no reason to postulate a different probability distribution of the sizes depending on the position of the vent) or “True” on the contrary (for example for volcanic structures that are partially submerged by the sea, implying a different explosivity depending on the position of the vent or its depth under water)
- “n. sizes =”: the user should input the number of different size classes (Ns) characterising magmatic eruptions
- “file name = ”: the user should input the name of the text file in which the prior probability of the different size classes, and the past occurrences of eruptions of different size classes, are stored (e.g., “node_style.txt”, see below for its structure)
- Other files:
- node_vent.txt: in this file, there must be Nv lines, each corresponding to one possible vent position. The number Nv of possible vent positions is implicitly declared in the “Main Settings” block of pybet.cfg file, by defining the geometry. If geometry is “Field”, Nv is equal to Nr*Nc (see above in the block “Main Settings”); if it is “Cone”, Nv=5 (Central vent position and 4 radial sectors). In each line of the file, there must be 2 numbers: the first one is the prior probability of that vent position, the second is the number of past eruptions (in a complete dataset) occurred from that vent position. The sum of the prior probabilities over all the Nv vent positions must be 1 (due to the assumption that the Nv vent positions represent a complete and mutually exclusive set).
- node_style.txt:
- If the user has selected no dependence of node 5 on node 4 (“node 4-5 dependence = False” in the “Node Style” block of pybet.cfg), in this file there must be 1 line containing 2*Ns+1 numbers
- the first Ns numbers are the prior probabilities of the Ns size classes (and the sum must be 1)
- then there must be the equivalent number of data of such prior probability distribution
- finally, other Ns numbers corresponding to the number of past eruptions (in a complete dataset) of each size class
- If the user has selected no dependence of node 5 on node 4 (“node 4-5 dependence = False” in the “Node Style” block of pybet.cfg), in this file there must be 1 line containing 2*Ns+1 numbers
- If the user has selected a dependence of node 5 on node 4 (“node 4-5 dependence = True” in the “Node Style” block of pybet.cfg), in this file there must be Nv lines, each containing 2*Ns+1 numbers.
Monitoring parameters are organized in a separate file, each one providing the current status of the selected monitored quantities. The path to the this file is given by setting the parameter “monitoring” in the “Main Setting” block of pybet.cfg file. Any time the user decides to update the status of monitoring parameters, he/she can create a new file by simply coping the old one and modifying the new values recorded, in order to keep track of the evolution of the forecast.
Example of how a monitoring file has to be formatted:
[Unrest - Parameter 1]
name = Number of VT (M > 0.8) [ev/day]
value = 0
threshold 1 = 5
threshold 2 = 20
relation = >
weight = 1

[Unrest - Parameter 2]
name = Maximum magnitude (last month)
value = 0
threshold 1 = 2.5
threshold 2 = 3.0
relation = >
weight = 1

[...]

[Magmatic Eruption - Parameter #N]
name =  Tremor (last month)
value = 0
threshold 1 = 1
threshold 2 = None
relation = >
weight = 1

[...]
Each block is defined by the node name (i.e., Unrest, Magmatic, …) and the ordinal number of the parameter (i.e, Parameter 1, Parameter 2, …) for each node. Then, it follows a series of rows that define the “fields” that describe the parameter. The following fields are present:
- “name” is a description of the parameter;
- “value” is the measure at the time of the assessment (t = t0);
- “threshold 1” is the smallest value of the interval defining thresholds;
- “threshold 2” is the largest value of the interval defining thresholds;
- “relation” defines where anomalous values are, with respect to the interval of thresholds;
- “weight” defines the information weight of each parameter.
Boolean parameters are considered by setting “threshold 2 = None”
Disclaimer
Even though any volcanic system could theoretically be analysed with a BET tool, the critical role played by hazard assessments in civil protection issues prevents us from leaving the user free to use all the applications already available. Therefore, BET tools are provided “empty” and the user must provide by himself/herself all of the information of the volcano he/she is interested in.
The use of BET tools makes the user fully responsible of its input data, results and relative applications. By using or downloading one of the BET tools, the user accepts that INGV and authors are not responsible for any wrong application by the user who takes his/her own responsibility.
References
- Marzocchi W., L. Sandri, P. Gasparini, C. Newhall, E. Boschi (2004) Quantifying probabilities of volcanic events: the example of volcanic hazard at Mt. Vesuvius. J. Geophys. Res., 109, B11201, doi:10.1029/2004JB003155.
- Marzocchi,W., Sandri, L., Selva J. (2008) BET_EF: a probabilistic tool for long- and short-term eruption forecasting , Bull. Volcanol., 70, 623-632, doi:10.1007/s00445-007-0157-y
- Marzocchi, W., L. Sandri, Selva, J., (2010) BET_VH: a probabilistic tool for long-term volcanic hazard assessment, Bulletin of Volcanology, Volume 72, Number 6, 705-716, doi: 10.1007/s00445-010-0357-8
- Rouwet, D., Sandri, L., Marzocchi, W., Gottsmann, J., Selva, J., Tonini, R., Papale, P., (2014) Recognizing and tracking volcanic hazards related to non-magmatic unrest: a review. J. Appl. Volcanol. 3, 17. http://dx.doi.org/10.1186/s13617-014-0017-3.
- Sandri, L., Jolly, G., Lindsay, J., Howe, T., Marzocchi, W. (2012) Combining long- and short-term probabilistic volcanic hazard assessment with cost-benefit analysis to support decision making in a volcanic crisis from the Auckland Volcanic Field, New Zealand. Bull. Volcanol. 74, 705–723. http://dx.doi.org/10.1007/s00445-011-0556-y.
- Sandri, L., Thouret, J.C., Constantinescu, R., Biass, S., Tonini, R., (2014) Long-term multi-hazard assessment for El Misti volcano (Peru). Bull. Volcanol. 76 (2), 1–26. doi: 10.1007/s00445-013-0771-9.
- Sandri L., Tonini R., Rouwet D., Constantinescu R., Mendoza-Rosas A.T., Andrade D., Bernard B., VUELCO Book chapter, Under Review.
- Selva, J., Costa A., Marzocchi, W., L. Sandri, (2010) BET_VH: exploring the influence of natural uncertainties on long-term hazard from tephra fallout at Campi Flegrei (Italy), Bulletin of Volcanology, Volume 72, Number 6, 717-733, DOI: 10.1007/s00445-010-0358-7
- Selva, J., W. Marzocchi, P. Papale, and L. Sandri (2012a), Operational eruption forecasting at high-risk volcanoes: The case of Campi Flegrei, Naples, J. Appl. Volcanol., 1, 5.
- Selva, J., G. Orsi, M. Di Vito, W. Marzocchi, and L. Sandri (2012b), Probability hazard map for future vent opening at the Campi Flegrei caldera, Italy, Bull. Volcanol., 74, 497–510, doi:10.1007/s00445-011-0528-2.
- Thompson M.A., Lindsay J.M., Sandri L., Biass S., Bonadonna C., Jolly G., Marzocchi W. (2015) Exploring the influence of vent location and eruption style on tephra fall hazard from Okataina Volcanic Centre, New Zealand, Bulletin of Volcanology, 77(5), doi: 10.1007/s00445-015-0926-y
- Tonini R, Sandri L, Thompson MA (2015a) PyBetVH: a Python tool for probabilistic volcanic hazard assessment and for generation of Bayesian hazard curves and maps. Comput Geosci 79:38–46
- Tonini, R., Sandri, L., Costa, A., Selva, J. (2015b) Brief communication: the effect of submerged vents on probabilistic hazard assessment for tephra fallout. Nat. Hazards Earth Syst. Sci. 15, 409–415. http://dx.doi.org/10.5194/nhess-15-409-2015.